
Volcano monitoring: always keeping an eye on the volcano
Active volcanoes require constant monitoring to identify precursor signals that could indicate a potential eruption. There are many types of precursor signals, which can last from a few days to several years and may even vary within the same volcano, depending on the type of eruption that is about to occur! For this reason, volcano monitoring is a complex task, often full of uncertainty. In most cases, it is crucial to combine advanced technology with field campaigns, using a wide range of measuring instruments and techniques to gather as much information as possible about volcanic activity. Let’s explore how this fascinating work operates and the incredible techniques that make it possible!
SEISMOMETERS AND ACCELEROMETERS: LISTENING TO THE HEARTBEAT OF THE VOLCANO
Seismometers and accelerometers are essential instruments for detecting seismic signals and movements, such as earthquakes, which are very common in volcanically active areas. Earthquakes pose an indirect hazard due to the shaking and ground movements that affect populations near a volcano, but they are not necessarily indicators of a future or imminent eruption. However, determining the depth at which they occur and studying their variation over time provides us valuable information about the deep structure of the volcanic system. For this reason, in many volcanically active areas, institutions have deployed networks of seismometers and accelerometers that allow them to receive and analyse earthquakes in real time (Figure 1). Additionally, other seismic signals, such as volcanic tremor, can last for hours or even months and are usually caused by the ascent of magma toward the surface.
Now that we are almost experts in seismology, let’s try to interpret a seismic signal produced by a volcanic eruption. In Figure 1c, you will find data from a seismometer located in La Palma, which recorded numerous earthquakes during the 2021 eruption and helped us better understand magma movements at depth. The vertical axis of the seismic signal represents the hours of the day, while the horizontal axis shows the minutes. Can you determine at what hour and minute the earthquakes in the lower red band, corresponding to 6:00 AM, took place?
Exactly! At 6:13 and 6:24 in the morning. Do you see how the signal from the second earthquake is much more intense? That is because the shaking was significantly stronger! Specifically, the earthquake at 6:24 AM on 30/10/2021 was the first with a magnitude above 5 during the 2021 eruption, occurring at a depth of approximately 39 km.

Figure 1. a. Map of the island of La Palma showing the location of the active seismic monitoring network. b. Map of the western Canary Islands (from left to right, El Hierro, La Palma, La Gomera, and Tenerife) displaying earthquakes of different magnitudes detected by the seismic network between 24/09/2024 and 17/12/2024 (90-day period). c. Seismic signal from station TBT (HHZ), located in La Palma, on 30/10/2021. Modified from Instituto Geográfico Nacional (https://ign.es).
SATELLITES: A VIEW FROM SPACE
Satellites are one of our greatest allies in volcanic monitoring. Did you know that volcanoes often “breathe,” inflating and deflating as magma and gases move beneath the surface? Thanks to satellites, we can monitor these ground deformations and obtain regularly updated images, allowing us to detect gas emissions. Satellite imagery and data become even more useful when a volcano erupts, as they help us to assess the extent of lava flows, as well as the height, dispersion, and composition of the eruptive column and cloud, enabling us to estimate their direction and reach in real time (Figure 2).
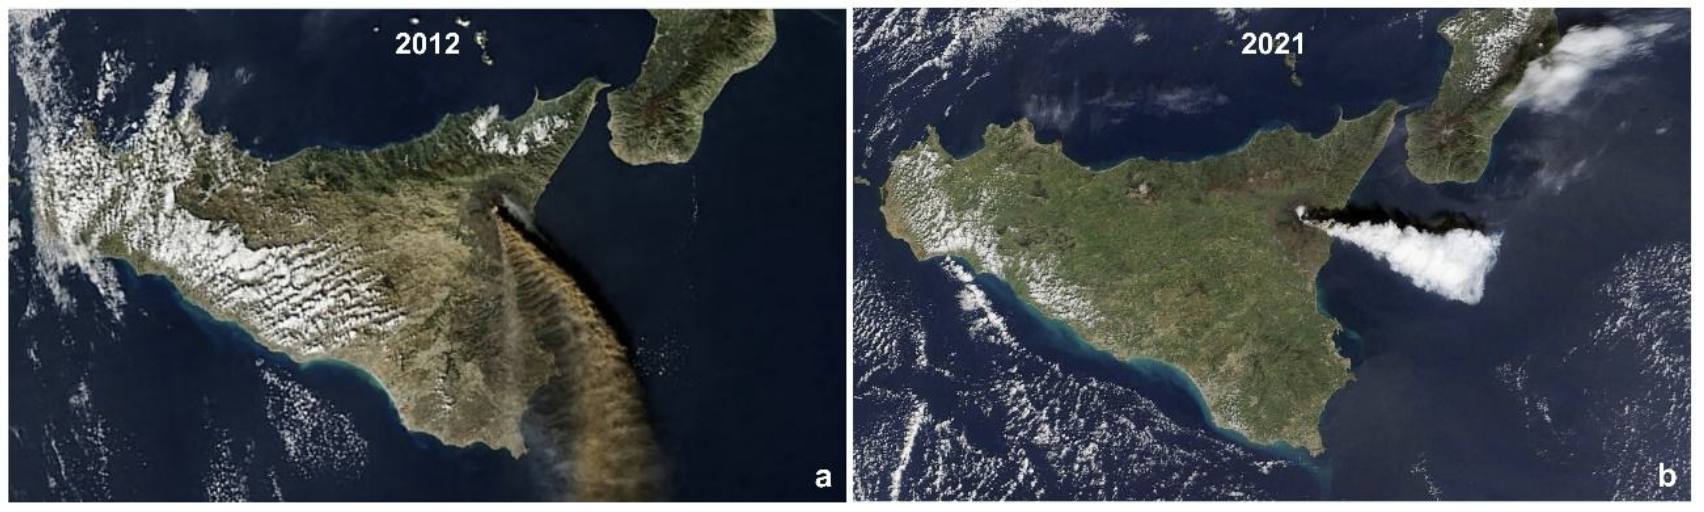
Figure 2. Satellite images of Sicily (southern Italy) during the Etna eruptions in 2012 (a) and 2021 (b). Take a close look! Thanks to these images, it was possible to determine the direction in which the eruptive column and cloud dispersed during these two eruptions. This direction depends on the prevailing winds. In these cases, the dominant wind was blowing south in 2012 and east in 2021. Modified from NASA (Modis-TERRA; https://terra.nasa.gov/) and ESA (https://www.esa.int/).
HELICOPTERS, DRONES, VESSELS: SURVEILLANCE BY SEA AND AIR
Helicopter reconnaissance flights provide a wealth of information during a volcanic eruption. They help us to figure out the extent of the eruption, the exact locations where volcanic material is being emitted, and the direction of lava flows (Figure 3). However, as we have learned in the blog on volcanic hazards, ash emissions can damage and disable aircraft engines, sometimes making their use impossible. To address this issue, drones have revolutionised volcanic monitoring. Equipped with high-resolution cameras, thermal sensors, and tools for collecting gas or ash samples, drones allow scientists to explore areas that are otherwise inaccessible and hazardous for humans. All of this is controlled by skilled drone operators, who can pilot them from kilometres away from the eruption, minimising risks and reducing the flight hazard to material losses (Figure 3a). Additionally, they are more cost-effective and environmentally friendly than helicopter flights.
In addition to these aerial methods, monitoring from maritime assets equipped with scientific technology is crucial during submarine eruptions or those occurring near the coast. Oceanographic vessels, such as the Sarmiento de Gamboa (operated by the Spanish National Research Council, CSIC), have played a key role in mapping the seafloor, collecting samples, and assessing volcanic hazards, as demonstrated during the 2011 eruption of the Tagoro volcano in El Hierro (Figure 3b).
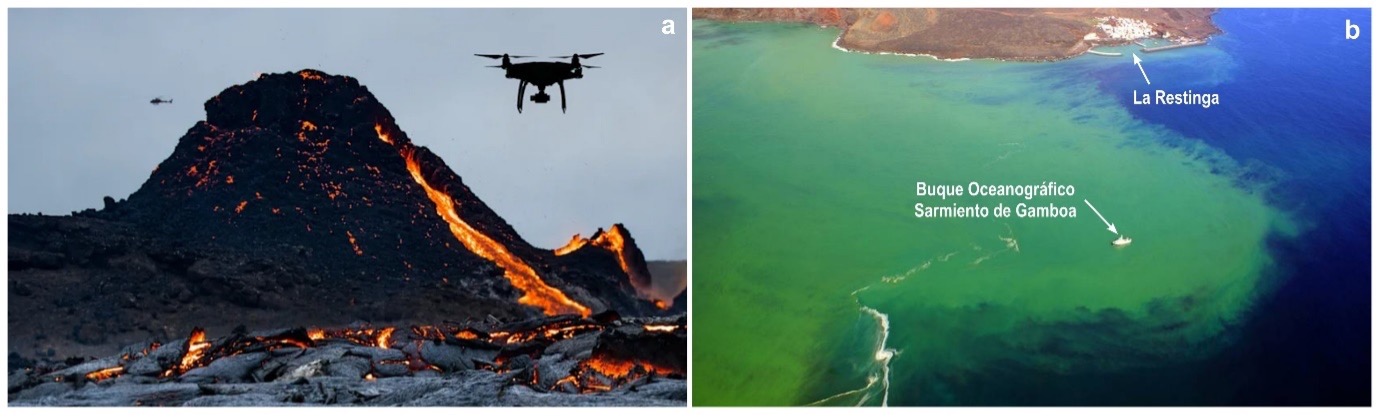
Figure 3. a. Helicopter and drone monitoring during an effusive eruption on the Reykjanes Peninsula (Iceland). The drone allows for closer proximity to volcanic materials while ensuring pilot safety; https://island.is/. b. Photograph taken from a helicopter during the 2011 submarine eruption in El Hierro. The image shows the oceanographic vessel Sarmiento de Gamboa, deployed to the eruption site for sampling, monitoring, and volcanic surveillance; photo by INVOLCAN and Guardia Civil.
GRAVIMETERS, GNSS TECHNIQUES, INCLINOMETERS: DEFORMATION AND INTERNAL VARIATION
As we have learned, magma moves beneath the Earth’s surface. This movement can cause a mass of magma to mix with others, become trapped again, or eventually rise to the surface and trigger an eruption. Gravimeters (Figure 4a) measure small changes in gravitational force caused by variations in the amount and distribution of magma at depth, as it has a different density than the surrounding rocks. Acting like a “magma detector,” this instrument helps scientists to understand how magma moves beneath volcanoes, providing crucial information for anticipating a possible eruption. Additionally, magma movement can also be measured using GNSS (Global Navigation Satellite System, which includes GPS, GALILEO, and GLONASS; Figure 4b) and inclinometers, which enable scientists to detect millimetre-scale deformations in the terrain.
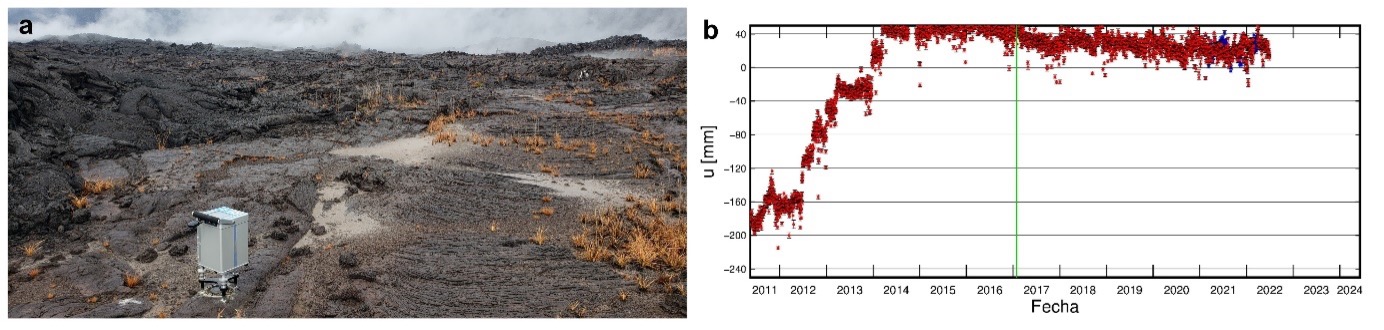
Figure 4. a. Gravimeter taking measurements on lava emitted during the 1919 Kīlauea eruption (Hawaii) to determine the amount of mass beneath the surface; https://www.usgs.gov/. b. Record of GPS measurements at the FRON station (El Hierro) during the period 2011–2022. In 2011, an upward trend of approximately 60 millimetres was observed, caused by the submarine eruption of La Restinga; https://www.ign.es/.
THERMAL CAMERAS AND THERMOMETERS: MEASURING VOLCANO'S HEAT
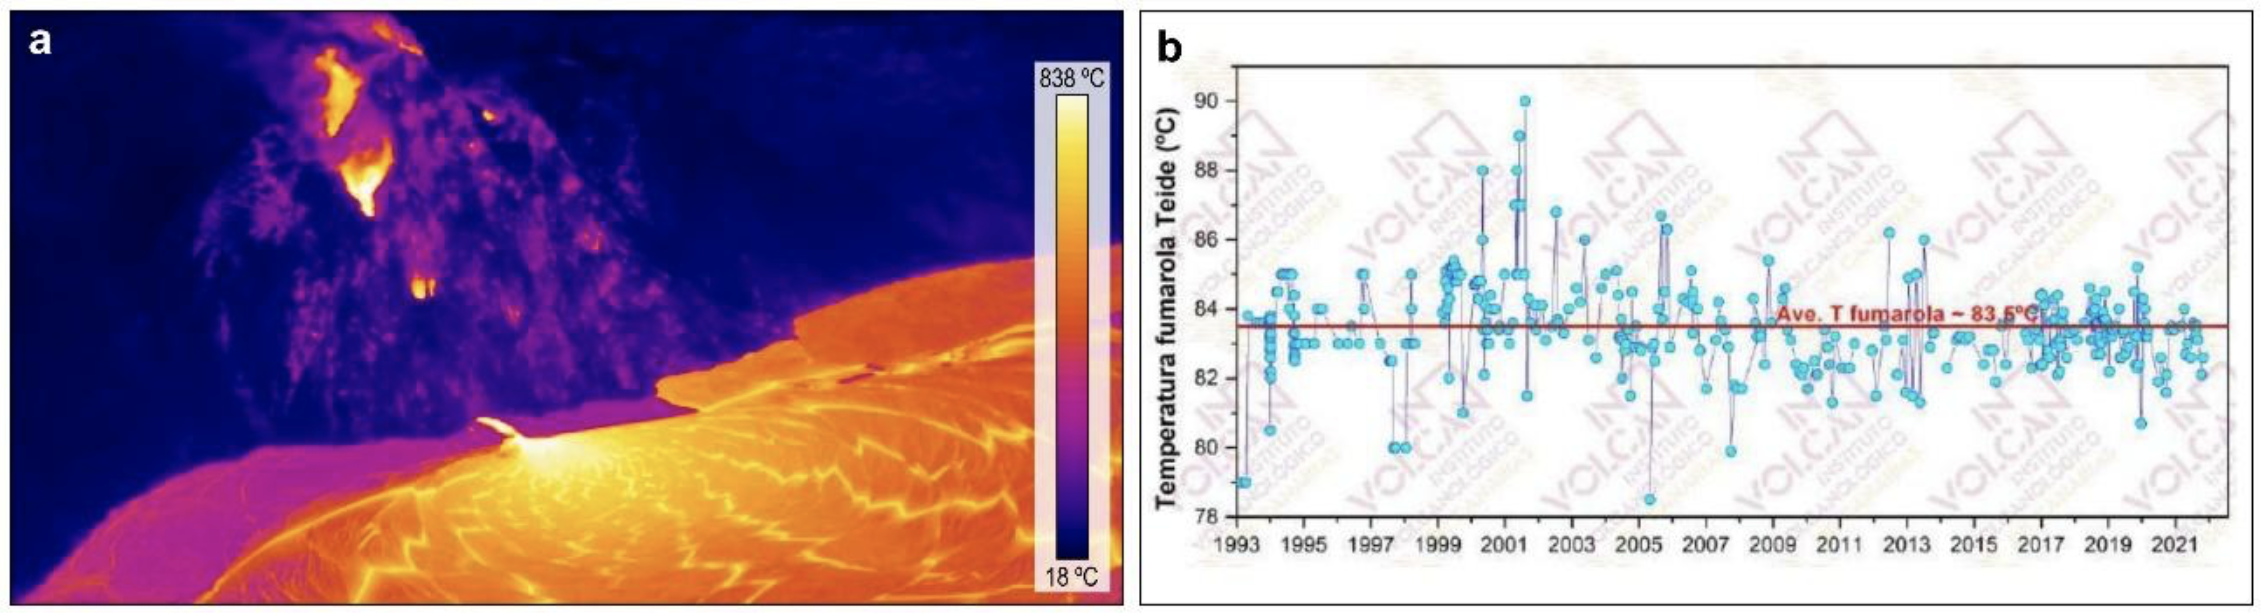
Temperature is another key indicator in volcanic monitoring. Thermal cameras help to identify the hottest and coolest areas of a volcano by recording temperatures in fumaroles, lava flows, and recently ejected materials. This data is crucial for forecasting potential eruptions and assessing associated hazards. Moreover, thermal cameras provide real-time images of hard-to-reach areas (Figure 5a), enabling scientists to detect thermal anomalies that might otherwise be unnoticed.
Thermometers in fumaroles also play a crucial role. By directly measuring the temperature of gases escaping from the volcano’s interior (Figure 5b), they help to identify changes in the dynamics of magmatic systems. For example, a rise in temperature may indicate an activity increase at depth, possibly linked to magma ascent or to more intense interaction between fluids and hot rocks.
PHYSICOCHEMICAL PROPERTIES: A WINDOW INTO THE MAGMATIC SYSTEM
The chemical composition of water, gases, and fumaroles in volcanic areas provides valuable clues about what is happening beneath the surface. An increase in the emission of gases such as sulphur dioxide (SO₂) or carbon dioxide (CO₂) can indicate magma ascent. The proportion of these gases can also help determine whether the magma is rising rapidly or remains confined at depth.
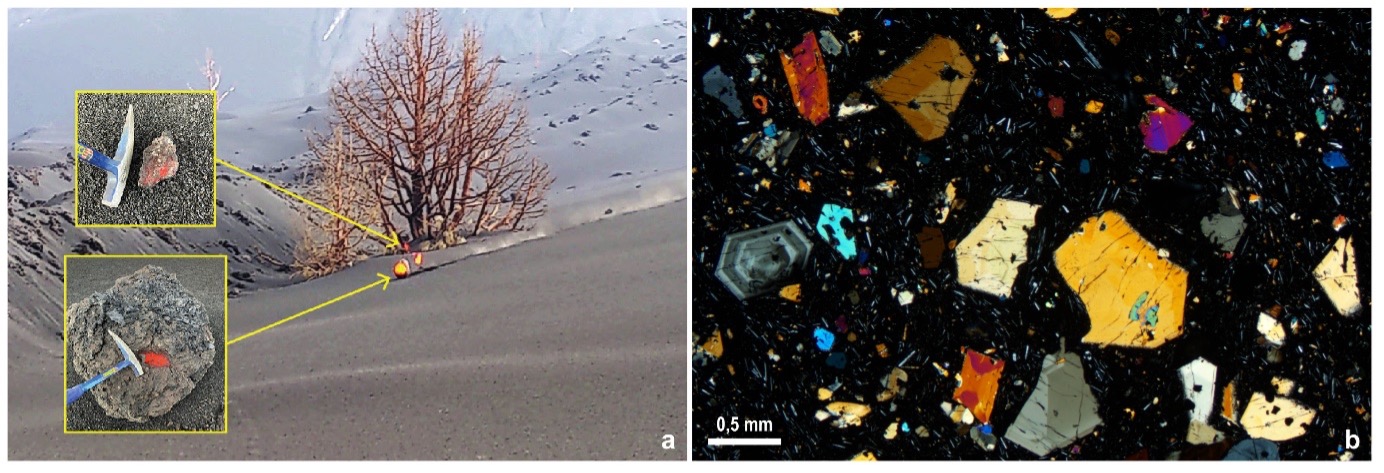
Regarding lava, its viscosity, mineralogy, and chemical composition provide key information about the type of eruption that might be expected. For instance, highly viscous lavas are often associated with explosive eruptions, whereas more fluid lavas typically occur during effusive eruptions. Sample collection is, therefore, a fundamental task in volcanic monitoring. On one hand, analysing past eruptions in an active volcanic area helps to predict the types and quantities of volcanic material that might be emitted in the future. On the other hand, sampling volcanic materials during an ongoing eruption (Figure 6a) allows scientists to understand the volcano’s dynamic behaviour, the composition of the magma, and forecast potential changes in eruptive activity, which is crucial for real-time risk assessment. Observations under a petrographic microscope(Figure 6b) and the chemical analysis of minerals in the laboratory enable scientists to estimate the pressure and temperature conditions at which they formed, offering a “snapshot” of the deep magmatic system.
In summary… Volcanic monitoring is a continuous, complex, yet fascinating task that combines science, technology, and dedication. Data obtained through instruments such as seismometers, satellites, gravimeters, and thermal cameras allow real-time analysis of volcanic activity and the issuance of volcanic monitoring reports that help protect lives and property.
Thanks to the Volcanic Monitoring Network of the Instituto Geográfico Nacional (IGN), the Canary Islands and their volcanoes are continuously monitored, integrating advanced technologies and predictive models to improve understanding and response to volcanic hazards. For more information on volcanic monitoring in the Canary Islands, visit the IGN website. Other world-renowned observatories that play a crucial role in volcanic monitoring include:
- Observatoire Volcanologique de Goma (OVG), Democratic Republic of the Congo.
- Alaska Volcano Observatory (AVO), United States.
- Red Nacional de Vigilancia Volcánica (RNVV), Chile.
- Instituto Geofísico de la Escuela Politécnica Nacional (IG-EPN), Ecuador.
- Osservatorio Vesuviano (INGV-OV), Italy.
- Japan Meteorological Agency (JMA), Japan.
- Iceland Meteorological Office (Veðurstofa Íslands), Iceland.
- GeoNet (NHC Toka Tū Ake y GNS Science), New Zealand.
- Philippine Institute of Volcanology and Seismology (PHIVOLCS), Philippines.
References
Aulinas, M., Rodríguez-González, A., Mínguez, H. A., del Carmen Cabrera, M., Carracedo, J.C., Day, J. M., Fernández-Turiel, J.L., Gazel, E., Geiger, H., Gisbert, G., Prieto-Torrell, C., Troll, V.R., Pérez-Torrado, F.J., 2021. La erupción de 2021 en La Palma (Islas Canarias) bajo el microscopio. Enseñanza de las Ciencias de la Tierra 29(2), 252-254.
https://raco.cat/index.php/ECT/article/view/427258
Carracedo, J.C., Troll, V.R., Day, J.M.D., Geiger, H., Aulinas, M., Soler, V., Deegan, F., Pérez-Torrado, F.J., Gisbert, G., Gazel, E., Rodriguez-Gonzalez, A., Albert, H., 2022. The 2021 eruption of the Cumbre Vieja volcanic ridge on La Palma, Canary Islands. Geol. Today 38, 94–107. https://doi.org/10.1111/gto.12388
If you want to cite this entry from the volkiblog:
Prieto-Torrell, C., Geyer, A., López, R., & Schamuells, N. (2025). VOLCANO MONITORING: ALWAYS KEEPING AN EYE ON THE VOLCANO. Zenodo. https://doi.org/10.5281/zenodo.14967377
Texts: Claudia Prieto-Torrell (GEO3BCN-CSIC), Adelina Geyer (GEO3BCN-CSIC), Rubén López (IGN)
Illustrations: Noah Schamuells (GEO3BCN-CSIC)
Terms of use: This document is published under a CC By-NC-ND (Creative Commons Attribution-NonComercial-NoDerivates) license. Downloading and sharing is allowed freely as long as proper credit is given. It may not be changed in any way or used commercially. For more information about the CC By-NC-ND click here.